THE DASHBOARD
In the Dashboard tab, the user can make selections to help diagnosed particular energy consumptions, savings ,and costs when remotely controlling the compressor and fan.
The user can compare performance of the HVAC system without the use of the device versus the performance of the system when the Clicksav device is in use. These two 7 day tests do not need to be consecutive.
In the first observation test, normally a demand response code 4 is set to direct a Clicksav device to be bypassed for 7 days.
Afterwards (in the second test) scheduled shut down(s), a demand response code 0 (normal device function, where compressor run and compressor rest take place) or other demand response code(s) are set during a period of 7 days.
Typical scenario example: A user wants to know the energy usage of the compressor running an entire day for particular days of the week. Afterwards, the user then wants to know the energy usage when the compressor is remotely turned OFF for several hours in those same days of the week. Together the user would want to average the savings by comparing the observations during those 2 weeks.
Refer to the Edit Device options in the Device Management section of the manual for further information, and where to select dates.
*The dashboard section and options are subject to change, be expanded, and be further developed in the future.
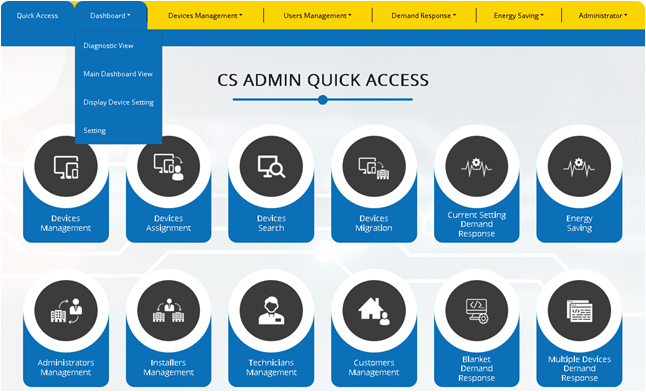
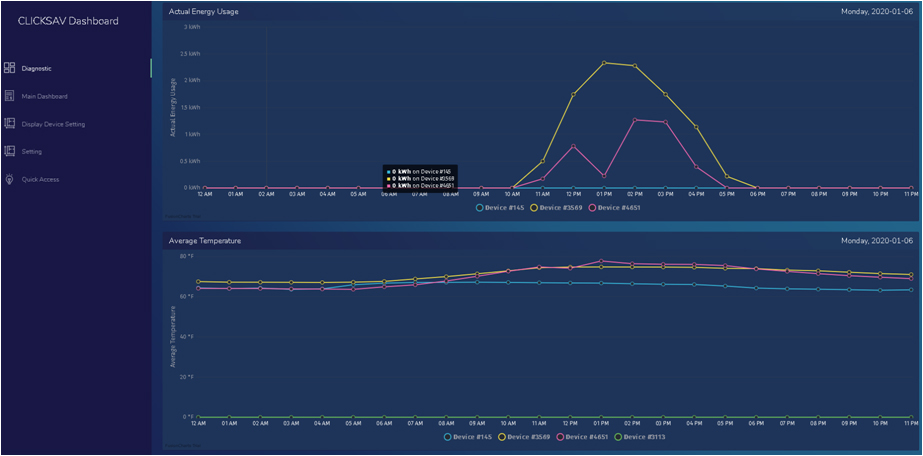
In the Diagnostic option, the user will be directed to the Energy Dashboard. The user can select a day, and create a list of one or multiple Clicksav devices. A day can be selected and confirmed by clicking on the filter button. Devices can be search by ID and selected to be included in the list. These devices can be removed from the list as well. Clicking on the x icon next to a device will remove the device. Graphs for average energy usage, average temperature and compressor run time will be displayed for those Clicksav devices selected.

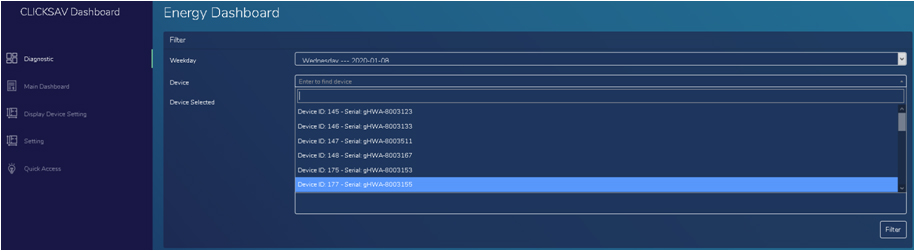
A day can be selected and confirmed by clicking on the filter button.


Devices can be added to the list. The example below shows device with ID 3155 searched and added to the current list
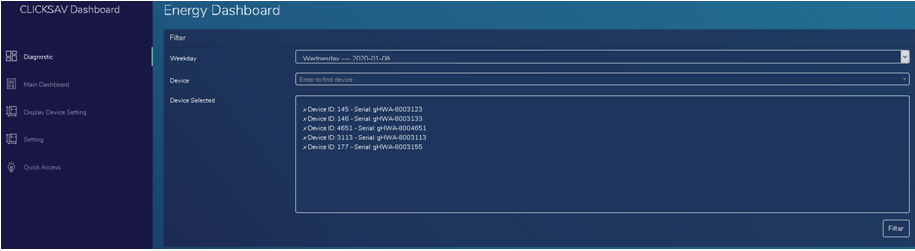
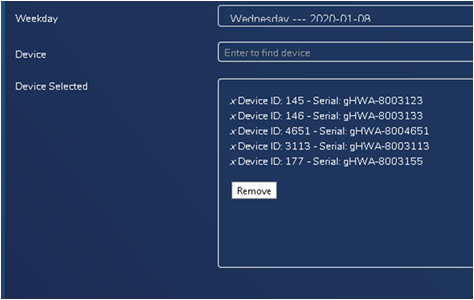
Devices can be removed from the list. The exampled below shows that device with ID 3155 is now removed from the current list

The next 2 examples show how graphs are displayed in the diagnostic link

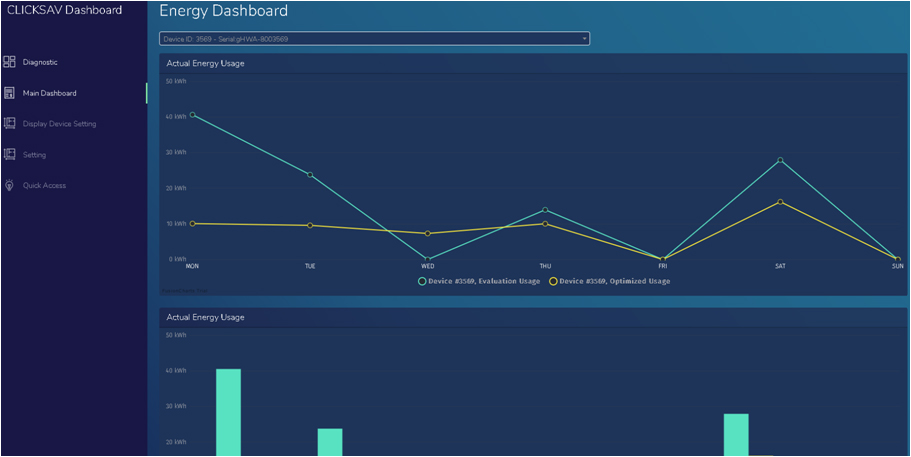
In the Main Dashboard option, the user will be directed to the data collected for the benchmark tests (7 days range tests). Data in this page can be used to be compared. The user can select a Clicksav device by ID.
Graphs for weekly energy savings and cost will be shown afterwards. Evaluation Usage refers to the 7 days the device was bypass and Optimized Usage refers to the 7 days the device was used to control HVAC system performance.
The Quick Access option will redirect the user to the Quick Access page.
Data collected from the benchmark tests for compressor run time can be compared through the following graphs.
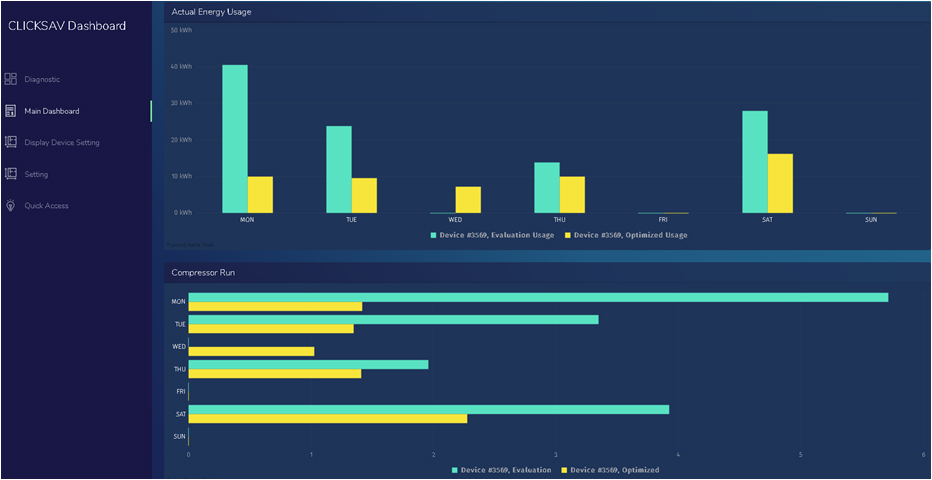
Total weekly energy usage and Total weekly cost from data collected during the benchmark tests can be compared in the following graphs.
Evaluation Usage refers to the 7 days the device was bypass and Optimized Usage refers to the 7 days the device was used to control HVAC system performance.

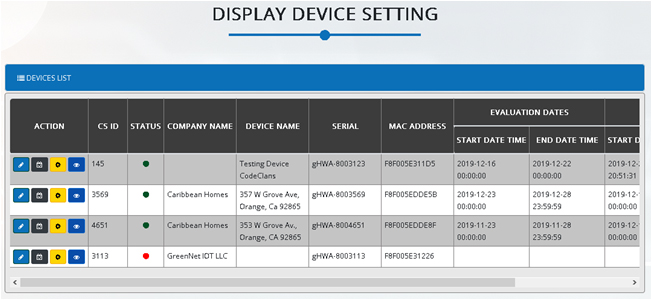
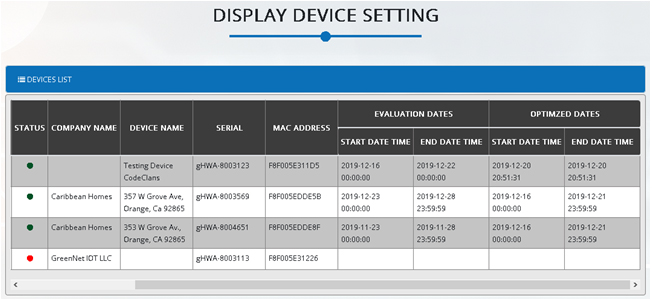
Display Device Settings allows to see the current devices selected for evaluation purposes in the diagnosis section of the dashboard.
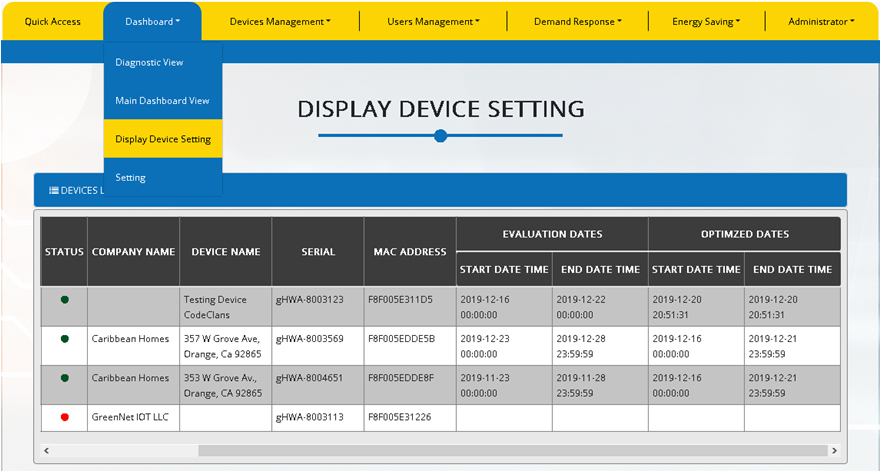
Dashboard Settings allows to globally control benchmark periods for a range of devices. Data to be collected from benchmark tests for a particular 7 day range can be set. The Evaluation period dates allows to set a 7 day range in which the device will be bypassed. Optimized period dates refer to a 7 day range where a device is used in particular way that affects the performance of the HVAC system.
